The Industrial Archipelago
Ten PlanetScope images to measure the scale of the Persian Gulf's fossil-fuel apparatus — and of the solar parks that are gradually rising alongside it
Published on Linkiesta · 8 May 2026
There is a problem of scale when talking about the Persian Gulf. The numbers are too large — twenty million barrels a day, a trillion cubic metres of gas, two trillion dollars — and too abstract for a reader to picture. The images are often worse: a close-up of a refinery, a detail of a platform, a patch of photovoltaic panels in the middle of the desert can be striking, but they don’t communicate scale, because they lack points of reference. Ten PlanetScope scenes, each with an AOI of roughly thirty square kilometres, offer an unexpected service: they give you the scale. They tell you that fossil fuel, in the Gulf, occupies the land not in hundreds of hectares but in hundreds of square kilometres; and that solar power, right next to it, is beginning to occupy it in the same way.
Fossil fuel
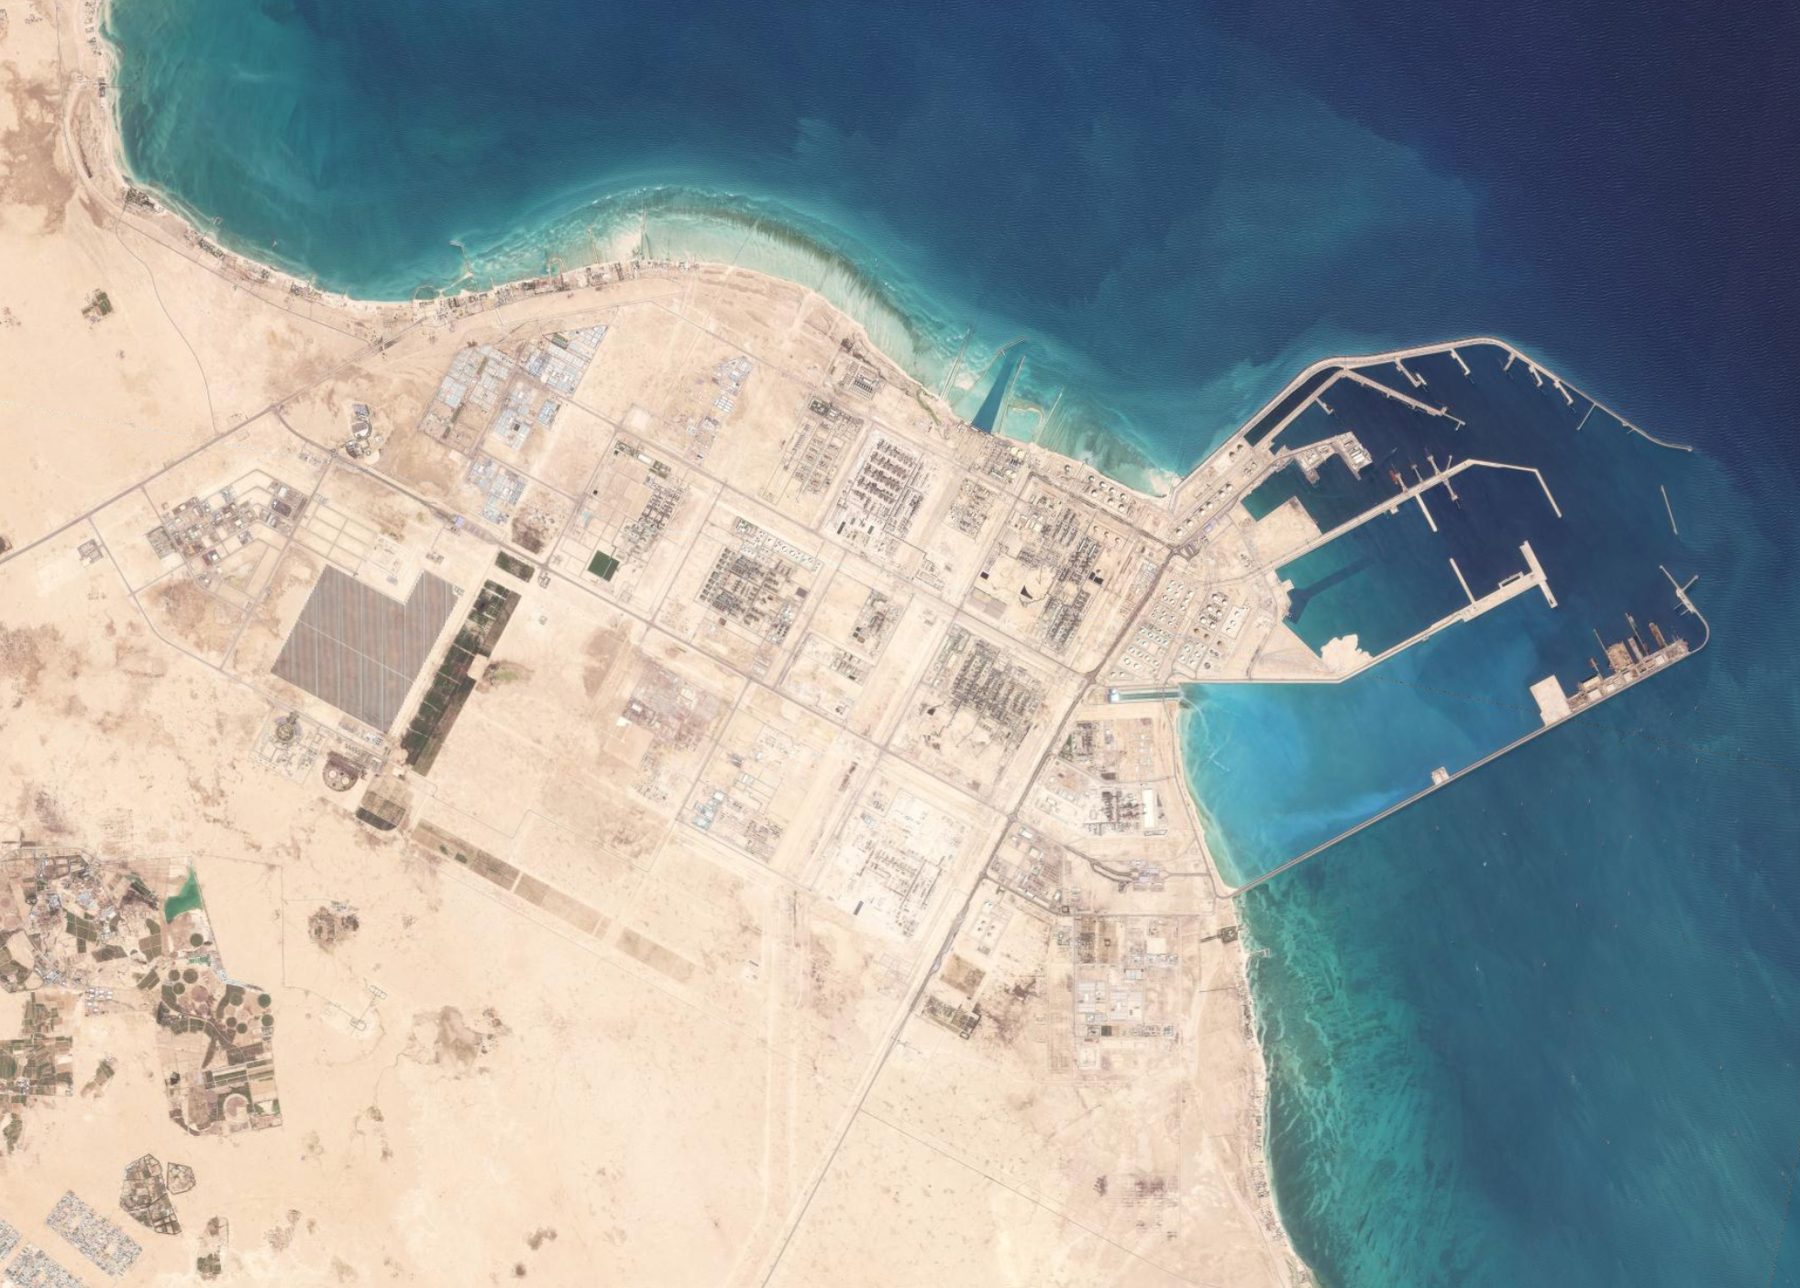
Figure 1 — The Ras Laffan complex, Qatar, captured by PlanetScope on 7 March 2026. The scene covers 25 km² (roughly the Republic of San Marino, or the municipality of Capri two and a half times over). On the left are the industrial sectors of the LNG liquefaction trains (the larger rectangular modules are Trains 4-7 and the first-generation Train 1, built between 1996 and 2009), a small recent photovoltaic plant (the dark rectangle just left of centre), and the new expansion works that will take the site’s capacity from 77 to 126 million tonnes of LNG a year by 2027. On the right, the double-basin port with the loading piers for LNG carriers: each pier is about 700 m long, and a Q-Max class carrier — the largest ever built — occupies nearly half of it. Ras Laffan alone accounts for a fifth of the planet’s LNG. Source: Planet Labs PBC.
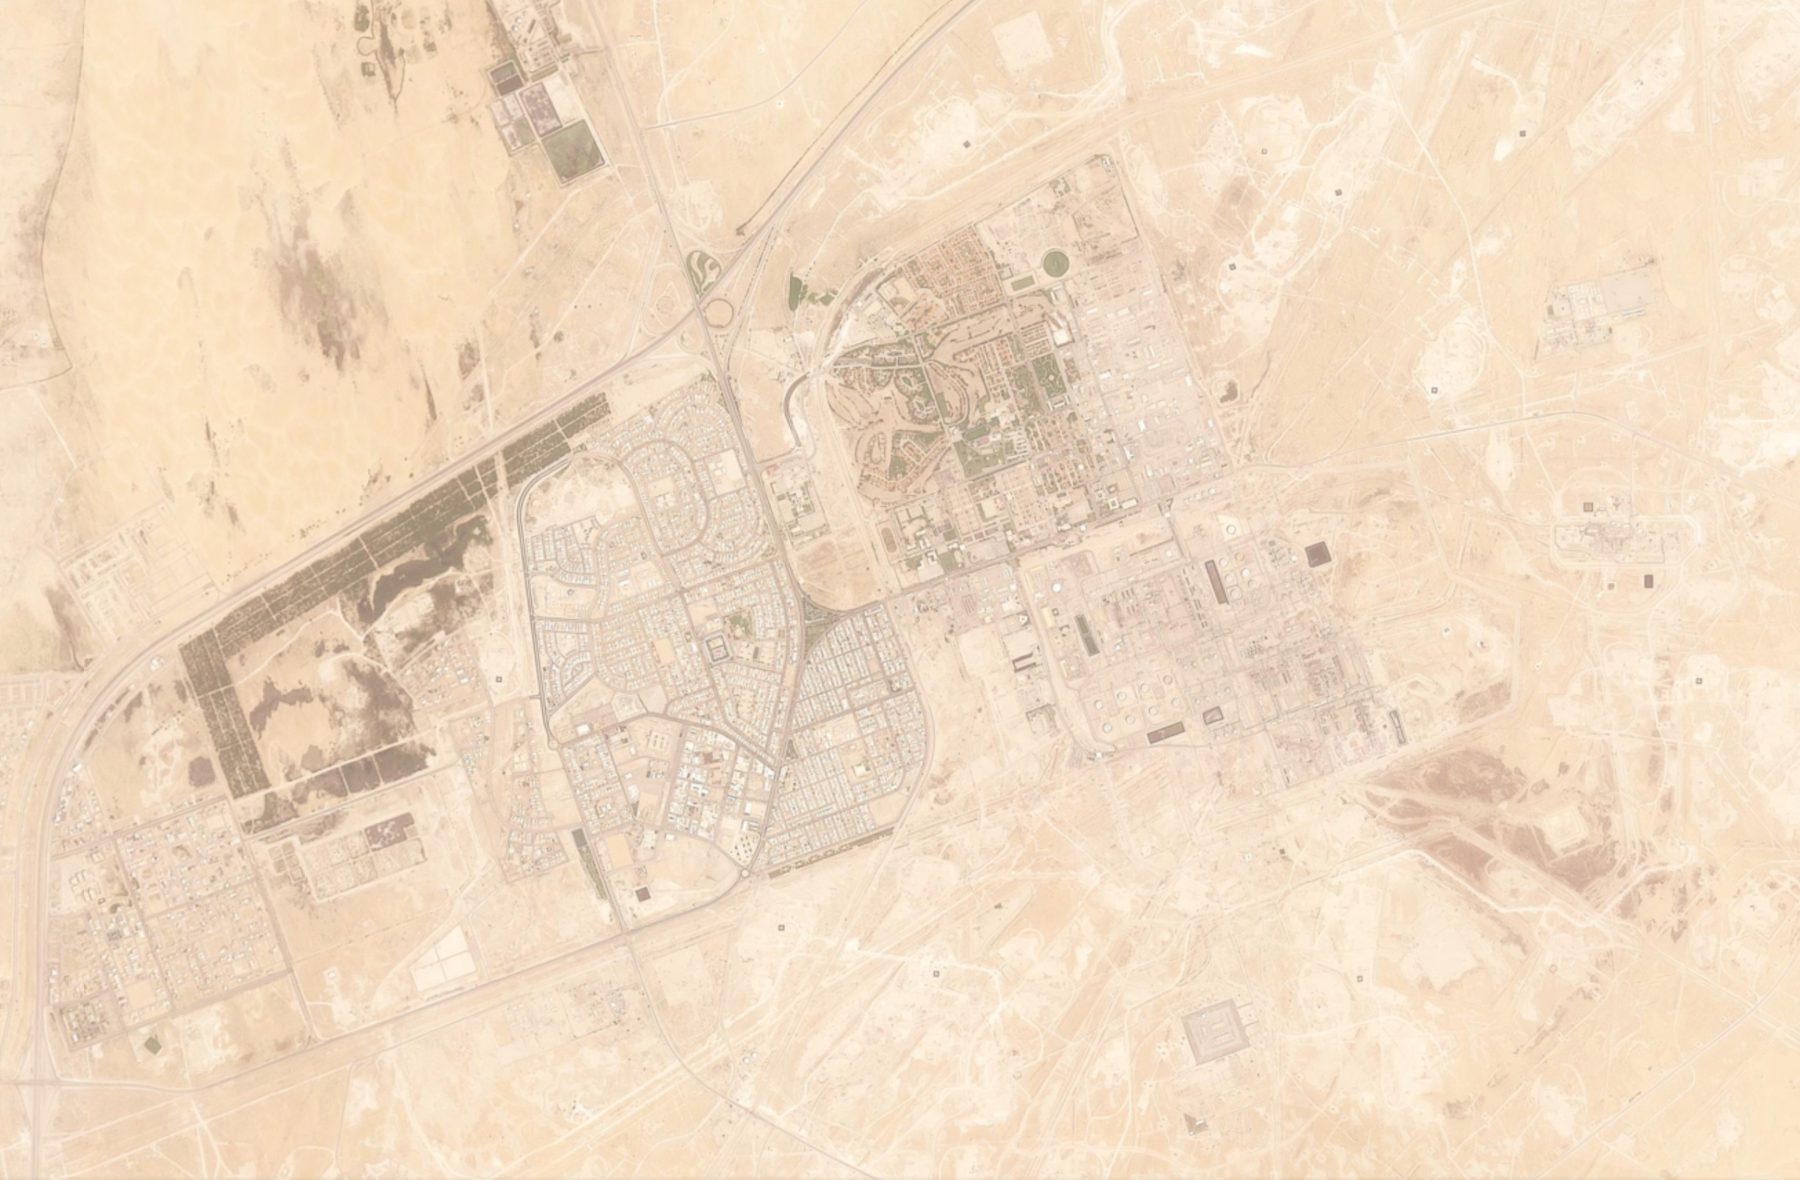
Figure 2 — Abqaiq, in eastern Saudi Arabia, is the world’s largest crude oil processing facility. The scene covers 36 km² (a little less than the municipality of Pisa). On the left are the regular blocks of the town of Abqaiq, home to some 30,000 Saudi Aramco employees and their families; in the centre, the processing areas — stabilisation columns, separators, tank farms. This is where crude from the Ghawar basin and other giant fields in the country’s Eastern Province converges by pipeline, before being routed to Ras Tanura for export. On 14 September 2019 this facility was struck by a drone and cruise-missile attack; in the following twelve hours Aramco temporarily lost five per cent of the world’s oil production. Traces of the reconstruction, completed within a few months, are still visible in the industrial areas at centre right. Source: Planet Labs PBC.
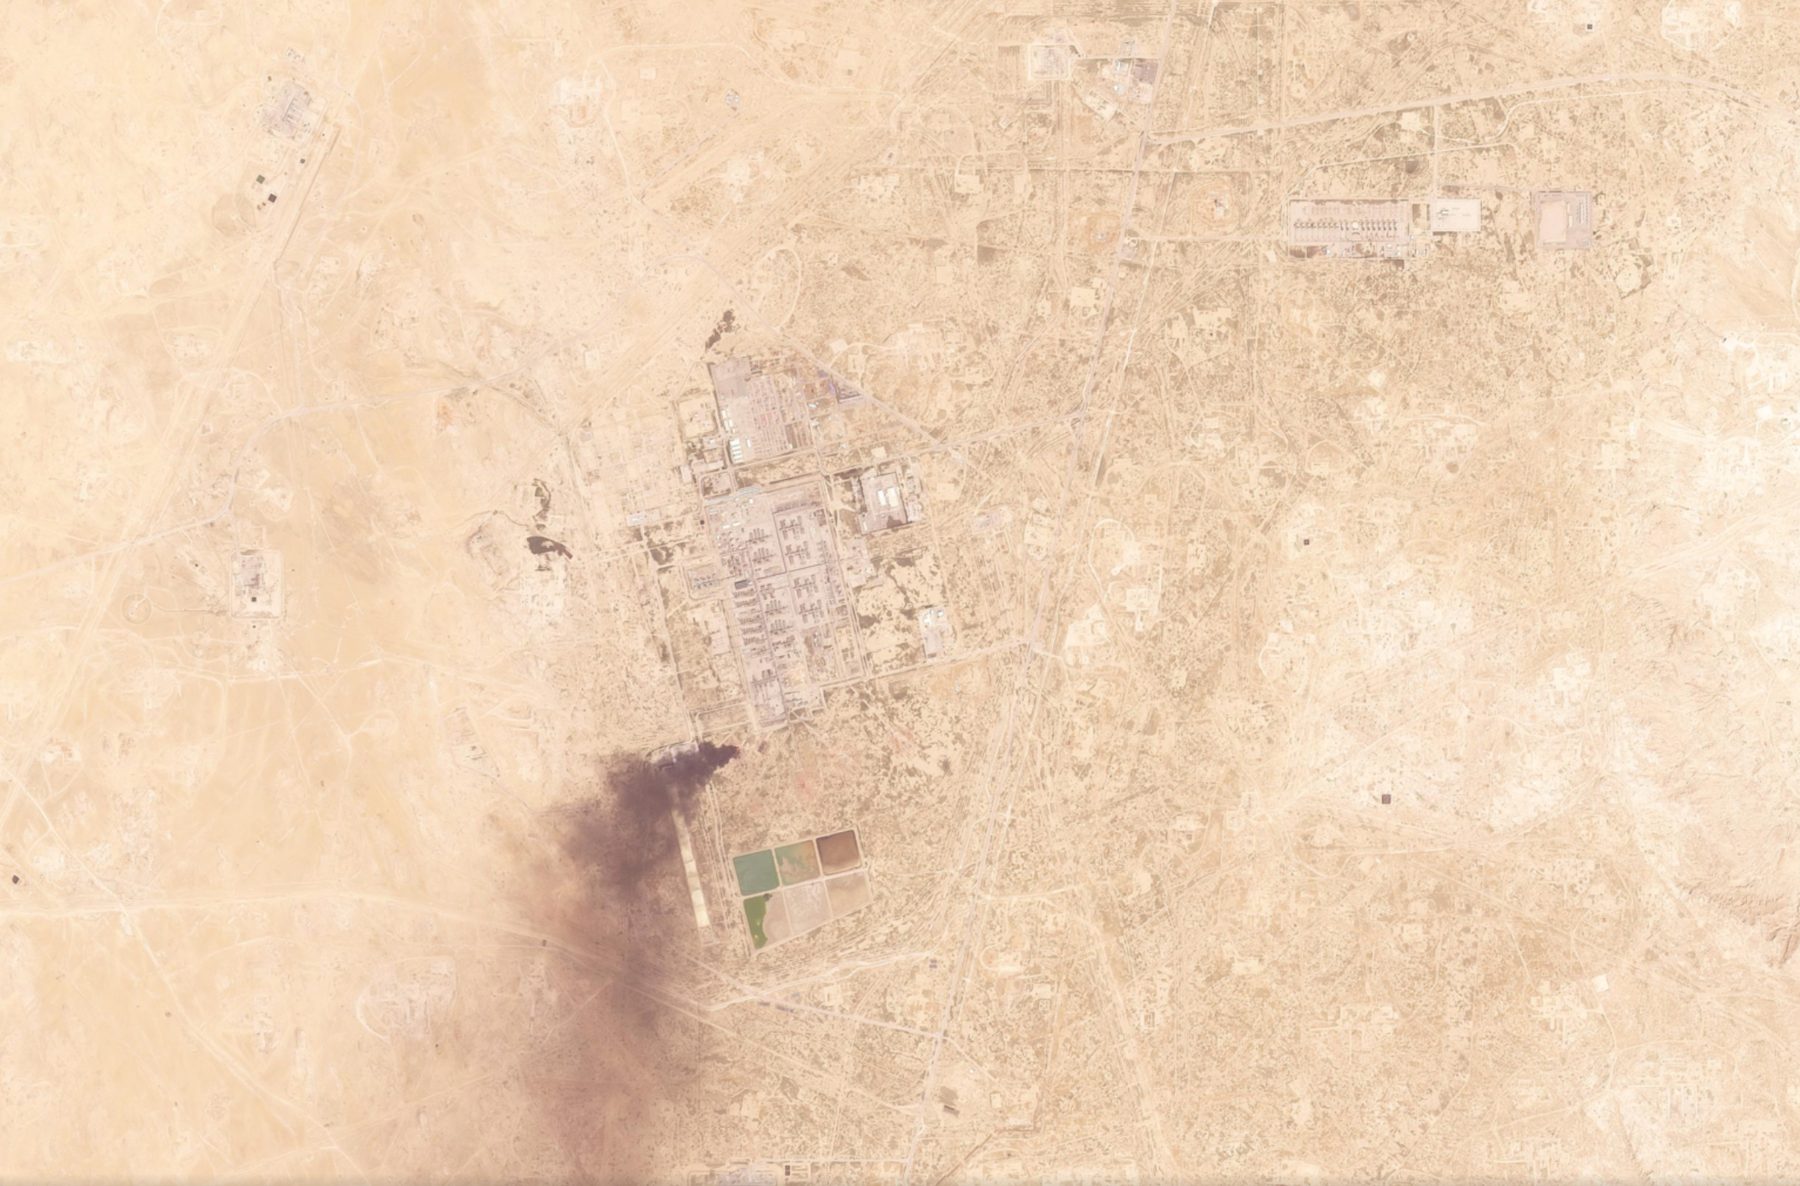
Figure 3 — A central portion of the Ghawar basin (Saudi Arabia), the largest oil field in history. The scene covers 27 km², but that is only 0.3 per cent of the field’s total extent, which measures about 280 km from north to south and 30 km from east to west, for a total area of 8,400 km² — a third of Lombardy. At the centre is a GOSP (gas-oil separation plant, the industrial module with tank farms and huts), surrounded by the regular grid of service roads linking the well pads (roughly one per kilometre). At bottom left, a telling detail: the dark plume of an active flaring flame, natural gas burned directly into the atmosphere for disposal. Global flaring is estimated to have released around 148 billion cubic metres of gas in 2024 — equivalent to the annual consumption of Germany and Italy combined. Source: Planet Labs PBC.
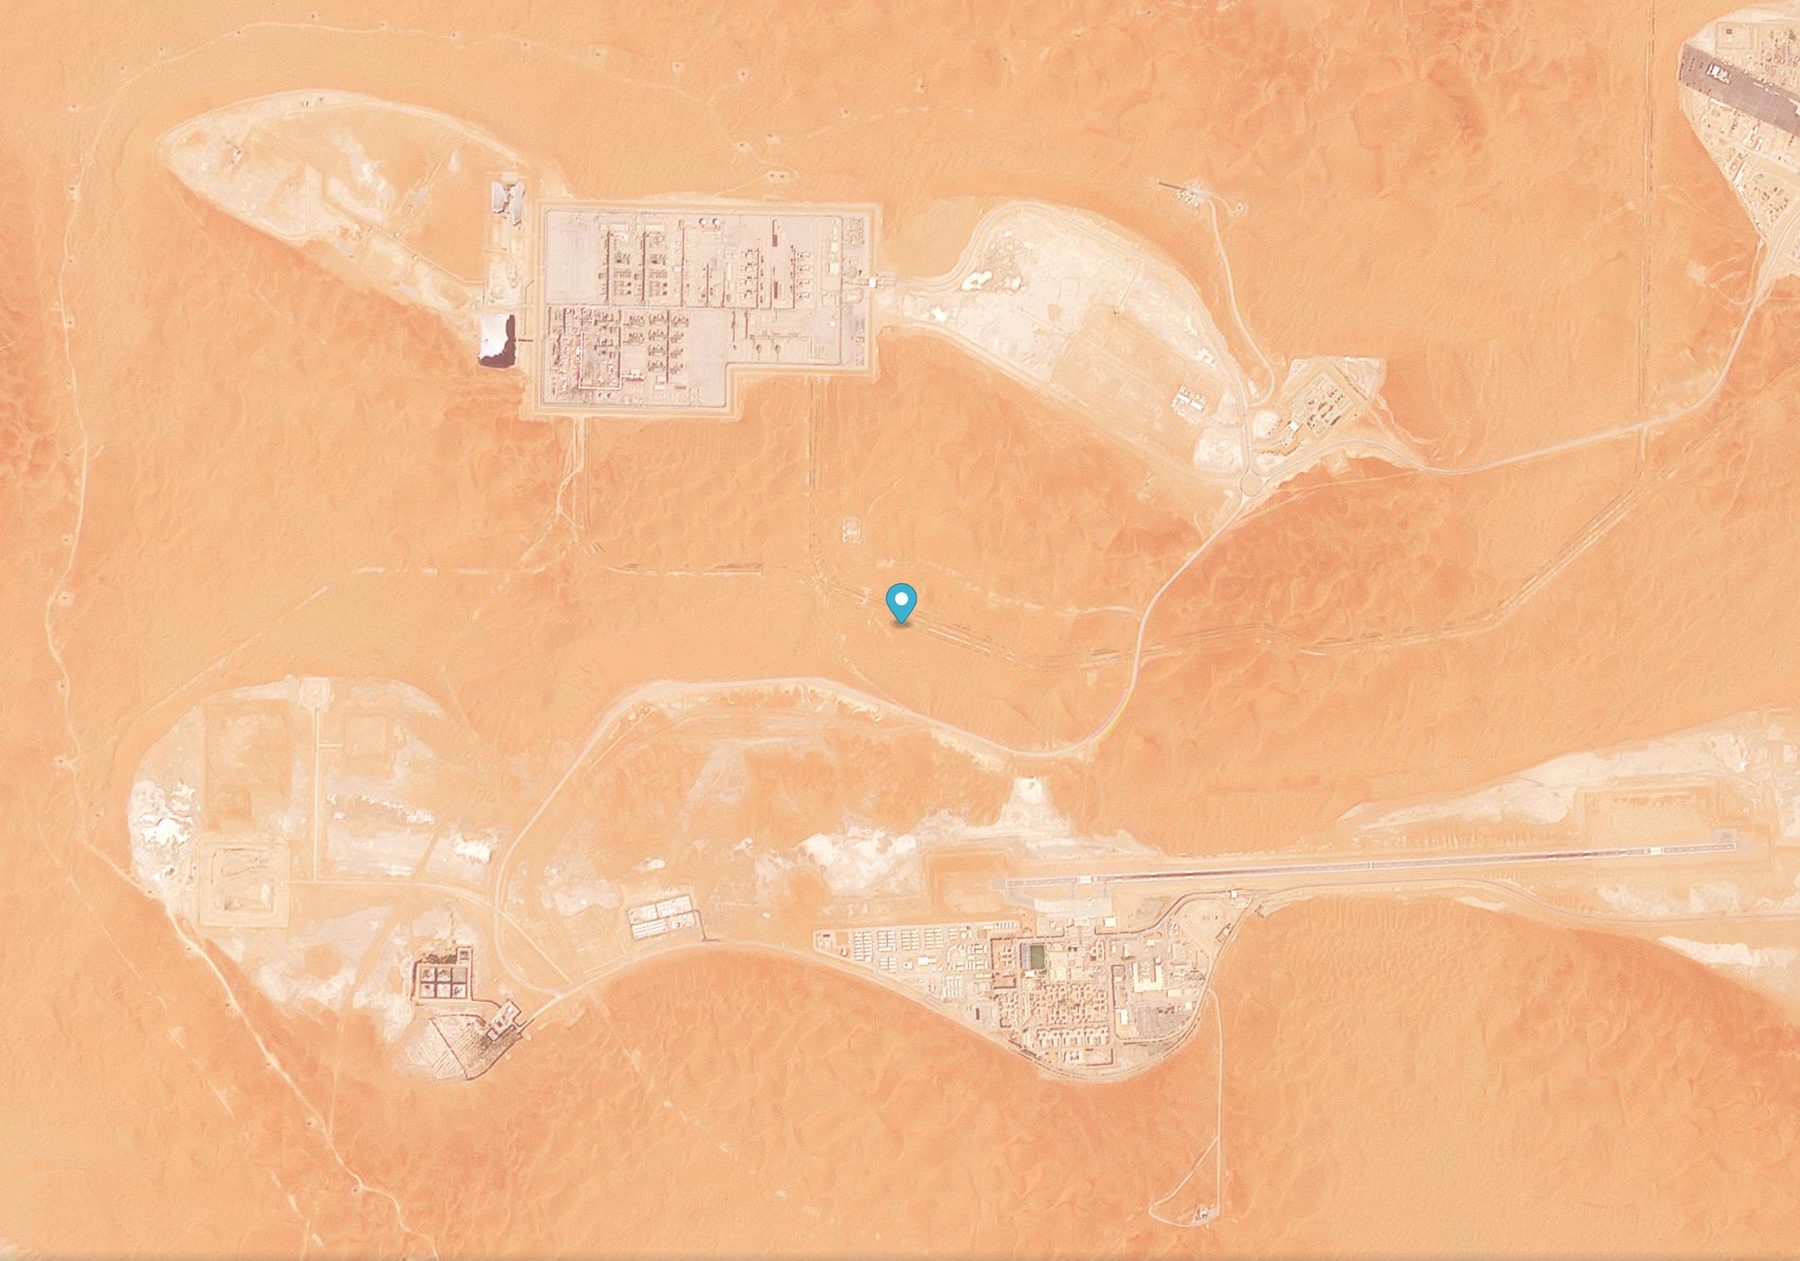
Figure 4 — The Shaybah complex, in the Rub’ al-Khali (the Saudi Empty Quarter), the largest sand desert in the world. The scene covers 34 km² and is entirely immersed in a sea of dunes, each two to three kilometres long and up to 250 metres high. At the top is the main GOSP; at the bottom, the residential compound and an airstrip (the clearly visible straight strip): Shaybah is practically self-sufficient, with its own desalination plant, housing for around 2,000 Aramco employees, and no urban infrastructure within 200 km. The Shaybah concession covers 14,000 km² — roughly Trentino-Alto Adige — and the wells scattered across the site are linked to the GOSP by a radial network of flowlines. About a million barrels of light crude leave here every day, crossing the entire breadth of Arabia to be loaded either at Ras Tanura or, via the Petroline, at Yanbu on the Red Sea. Source: Planet Labs PBC.
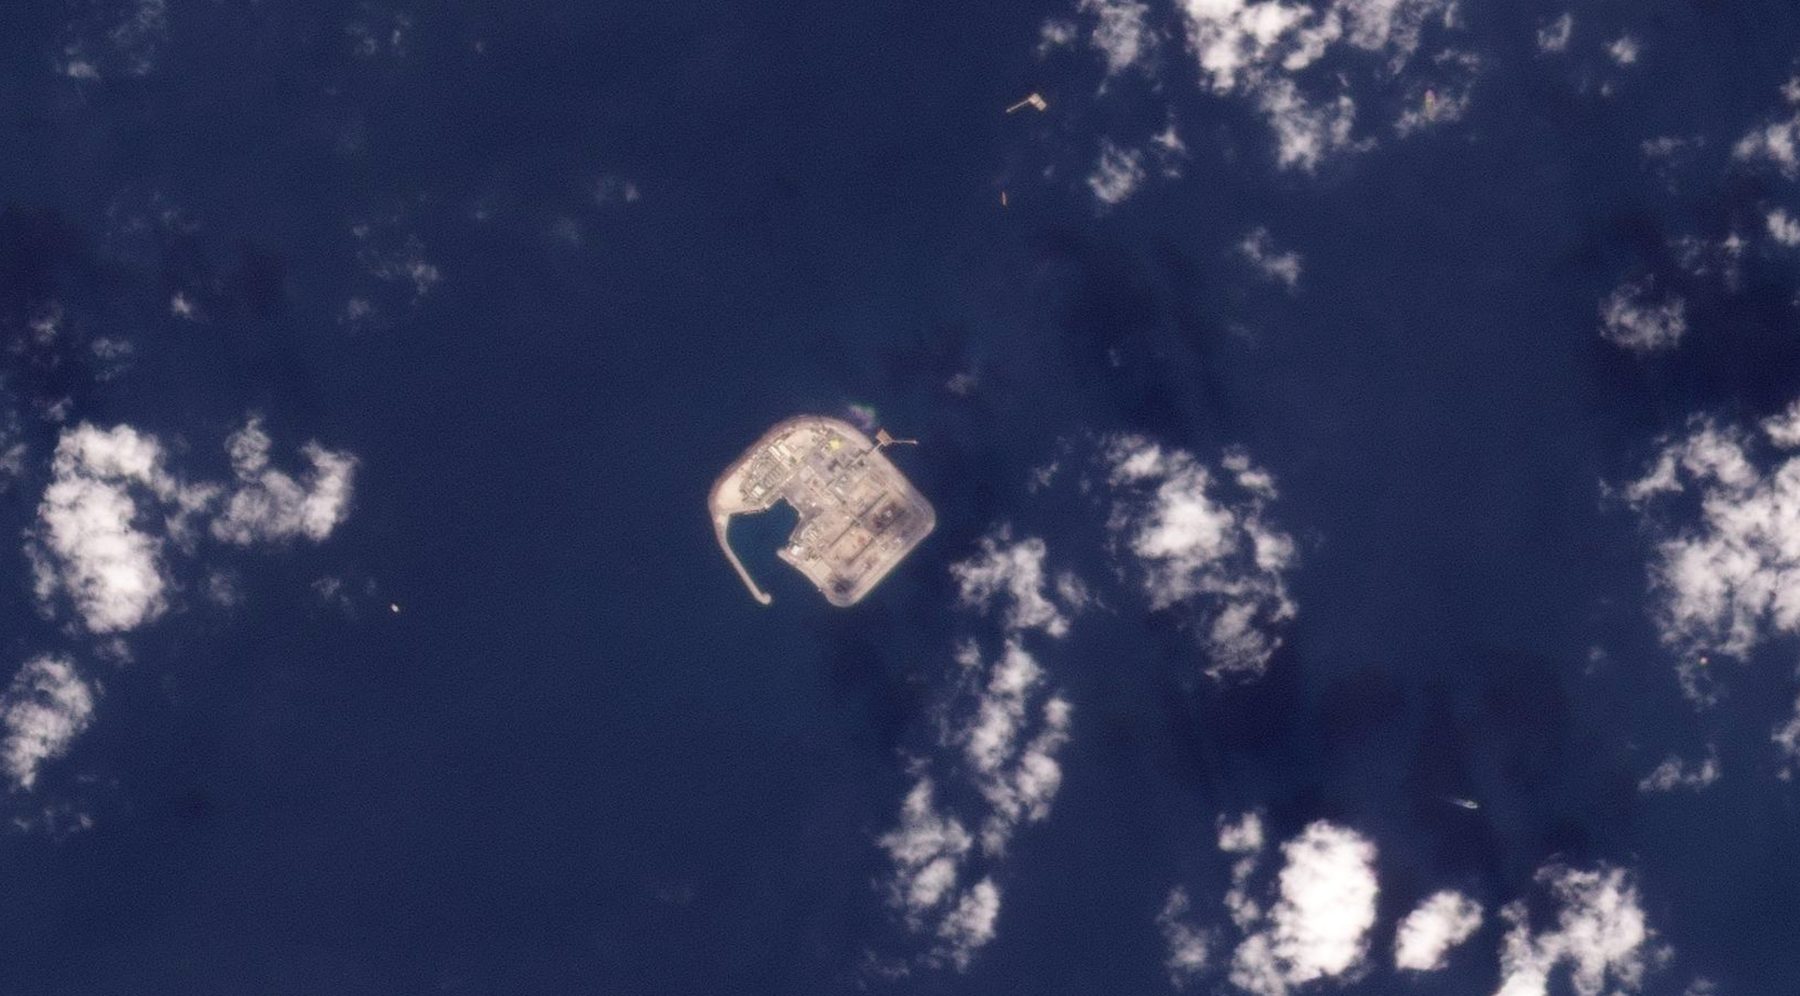
Figure 5 — The West Island of ADNOC’s Upper Zakum field, one of four artificial islands built in the United Arab Emirates between 2010 and 2018 (the others are Central, North and South). The scene covers 42 km² of open sea. The visible island (bean-shaped) covers about 5 km² and was created by dredging the floor of the Gulf to house a conventional onshore-style drilling site in place of the dozens of offshore platforms originally planned — a choice that cut the field’s development cost from 25 to 14 billion dollars. Horizontal subsea wells radiate out from this island and the other three in the cluster, reaching as far as 8 km from the pad. The Upper Zakum field beneath the sea covers 1,200 km² (roughly the province of Trento) and produces about a million barrels a day. Source: Planet Labs PBC.
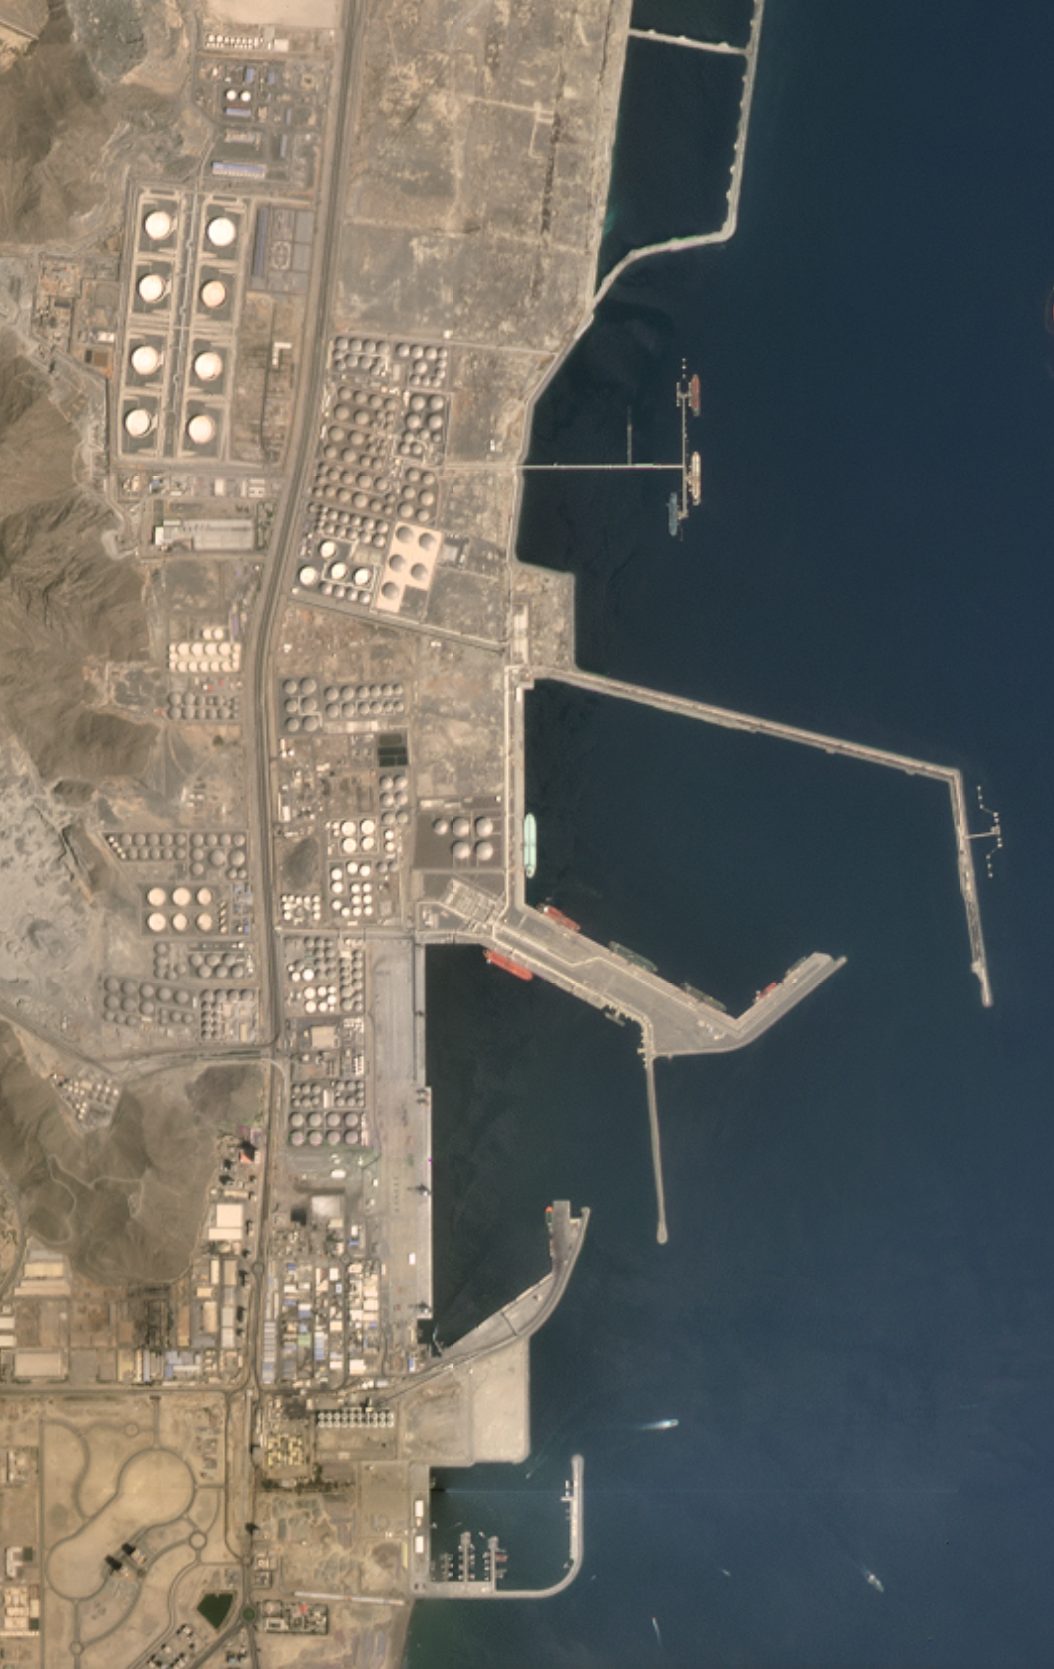
Figure 6 — The port of Fujairah, on the Gulf of Oman, the terminus of the ADCOP pipeline that carries Emirati crude without passing through the Strait of Hormuz. The scene covers 16 km², of which about 2 km² are occupied by the tank farm visible on the left: roughly 400 cylindrical tanks with a combined storage capacity of just over ten million cubic metres, or 63 million barrels — about forty days of Italy’s consumption. Fujairah is the world’s second-largest commercial bunkering hub after Singapore: hundreds of tankers load fuel and crude here every day, before continuing on to Asia or Europe. The central pier, about 800 m long, can berth eight large vessels at once. Source: Planet Labs PBC.
The sun
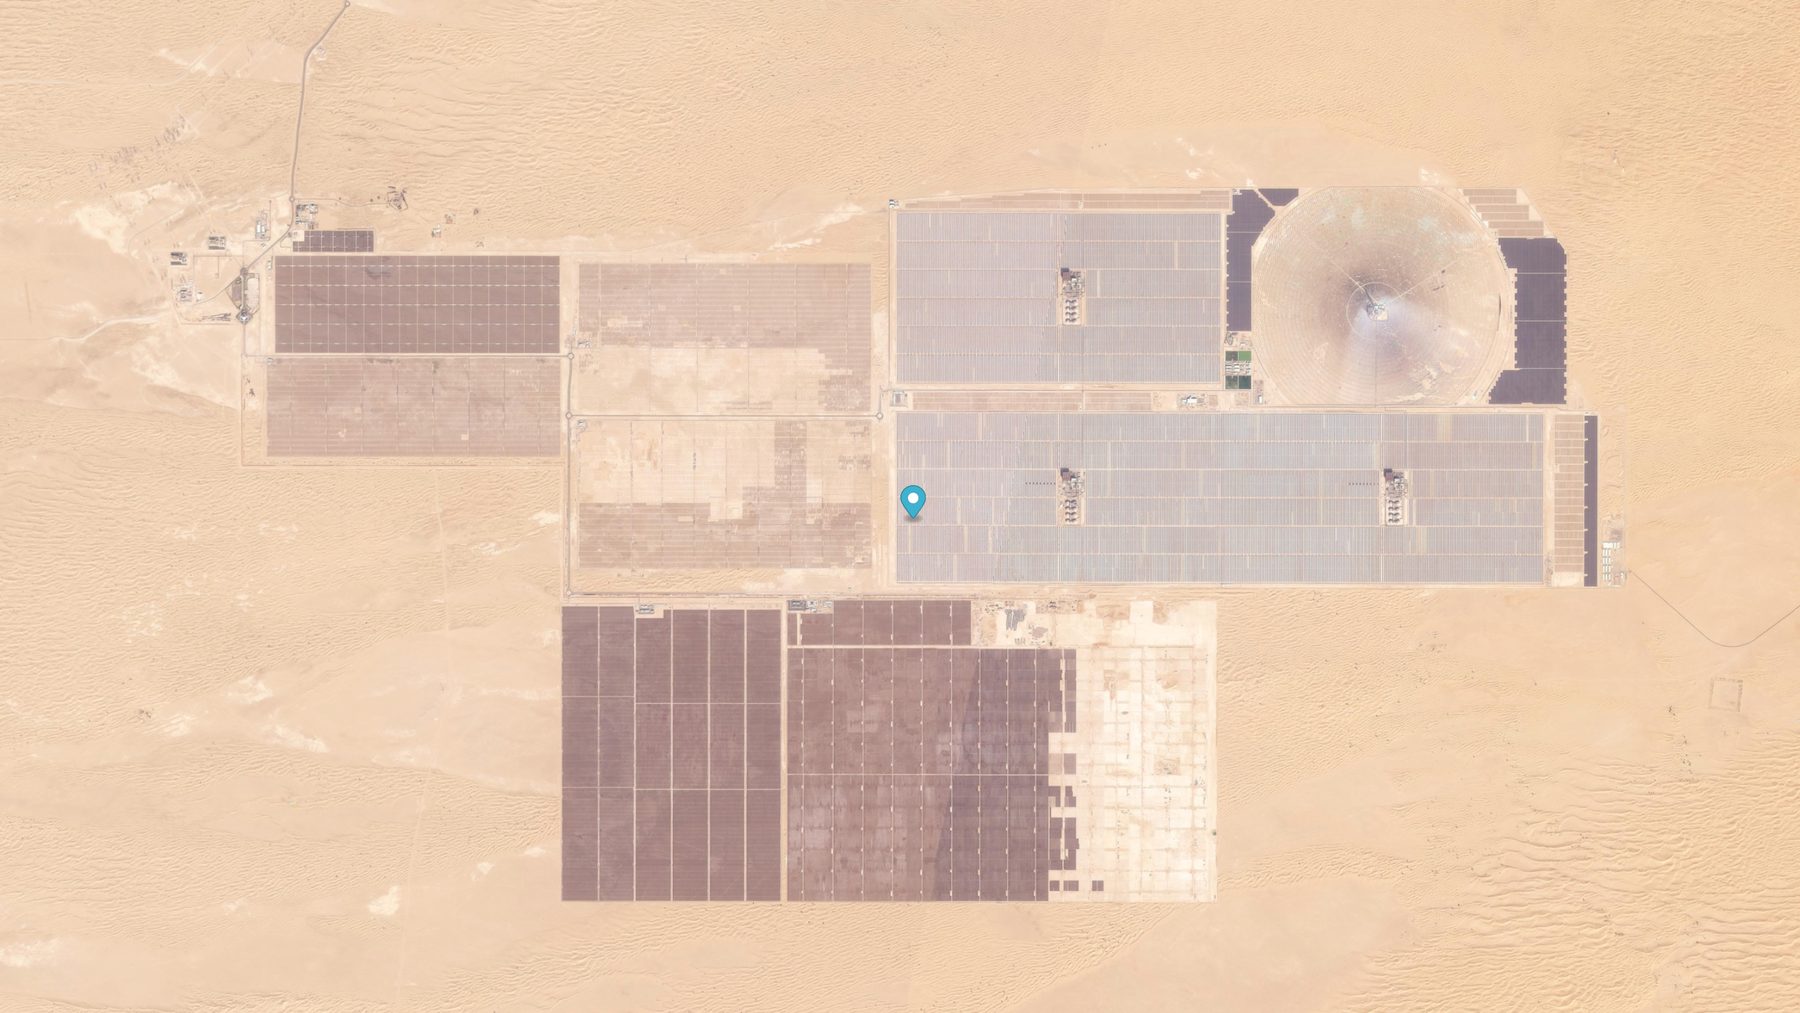
Figure 7 — The Mohammed bin Rashid Al Maktoum Solar Park, about 50 km south of Dubai. The scene covers 41 km², about two-thirds of the entire park, which extends over a total of 77 km² — the same area as the municipalities of Cuneo or Lecce. At least three distinct phases can be made out: the fixed and tracker-mounted photovoltaic panels of phases 1-3 (the dark rectangles on the left), the circular heliostat field of phase 4 (the dark disc at centre right), and a new photovoltaic phase at the bottom. At the centre of the heliostat field, clearly visible as a bright dot, stands the tallest solar tower in the world: 263 metres high, twice the height of the Mole Antonelliana, around which 70,000 mobile mirrors focus light onto the molten-salt receiver that generates steam at 565 degrees Celsius. The park’s total installed capacity is about 4 GW, being expanded to 5 — enough to power a million and a half Emirati homes during peak hours. Source: Planet Labs PBC.
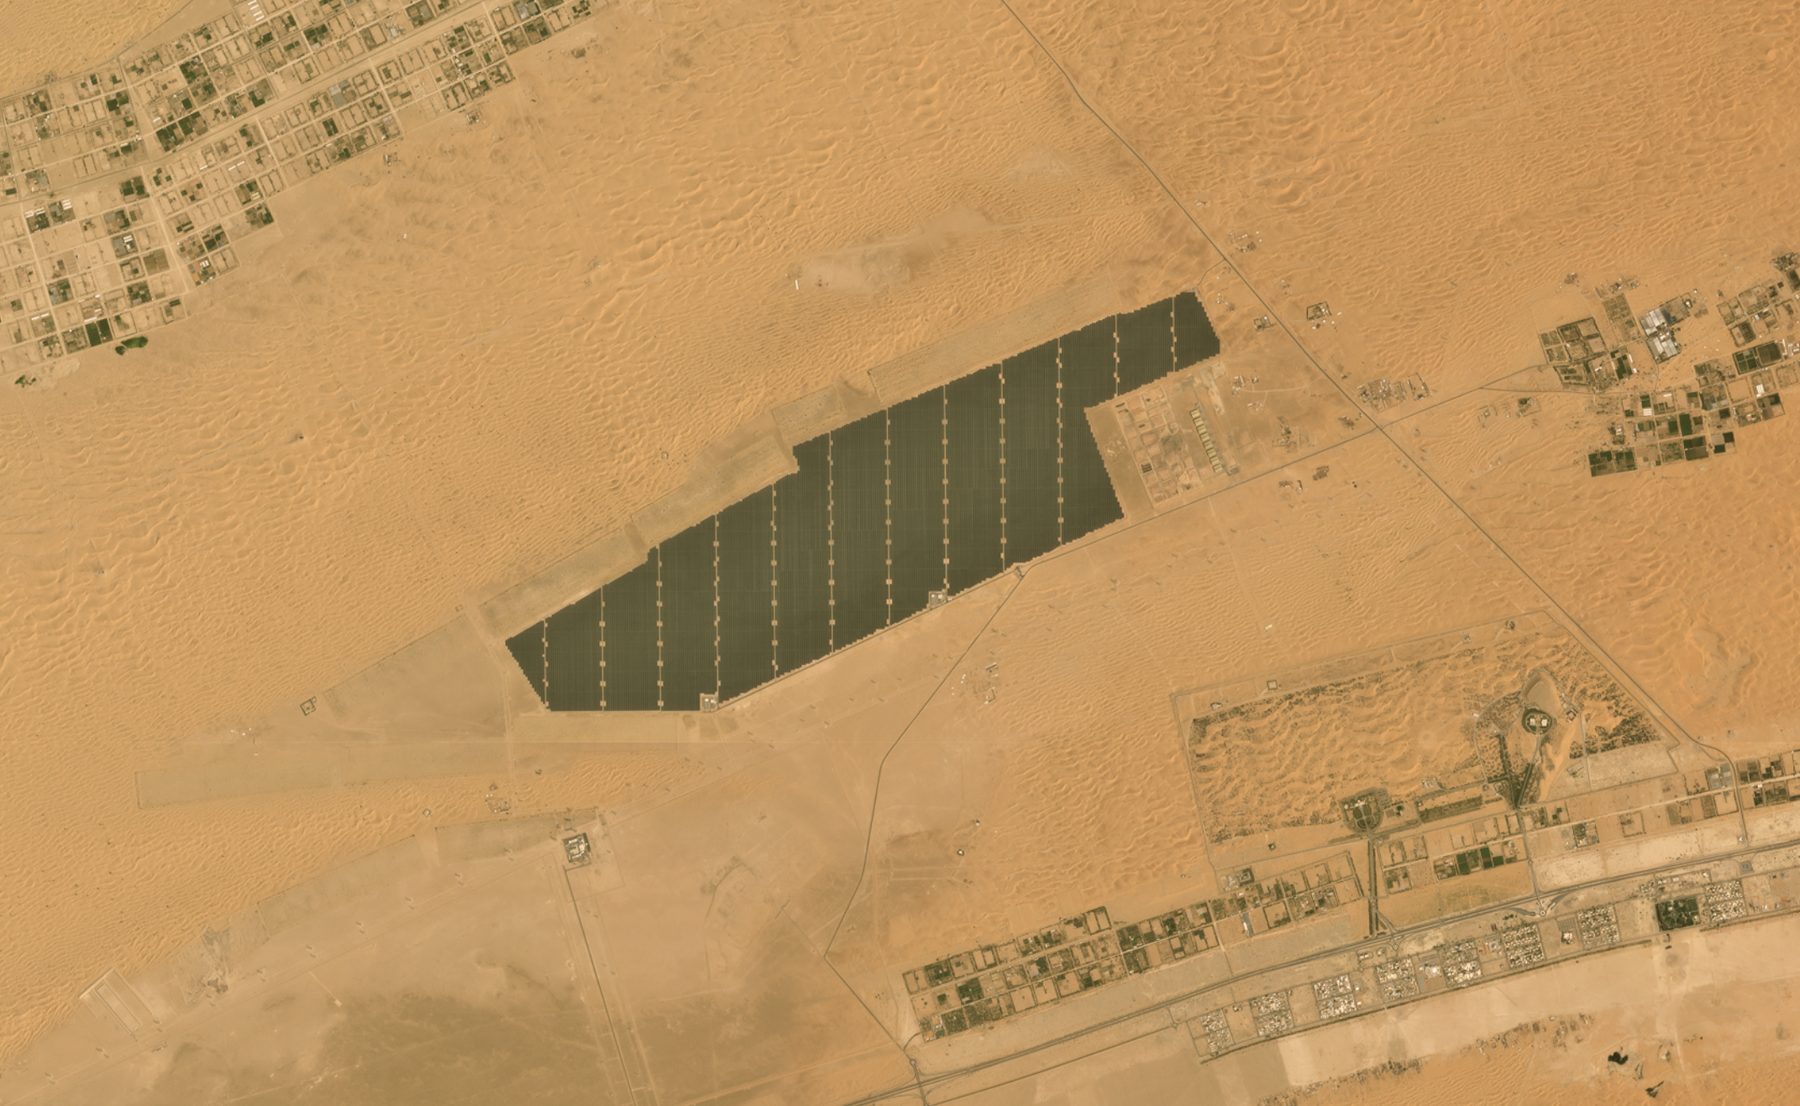
Figure 8 — The Noor Abu Dhabi photovoltaic park, near Sweihan, on the edge of the Liwa desert. The scene covers 25 km² of land, of which about 8 km² are occupied by the park proper (the large dark trapezoidal shape at the centre): an area equivalent to Lake Massaciuccoli, in Tuscany, or seven times the island of Capri. It was the Gulf’s first large solar park, operating since 2019 with a capacity of 1.18 GW and more than three and a half million modules on single-axis trackers. It is in turn connected, at bottom right of the image, to Sweihan airport and the settlement that serves it. When it came online, it was the largest single-site photovoltaic plant on the planet; seven years later, it has been surpassed threefold by MBR Solar Park and Al Dhafra. Source: Planet Labs PBC.
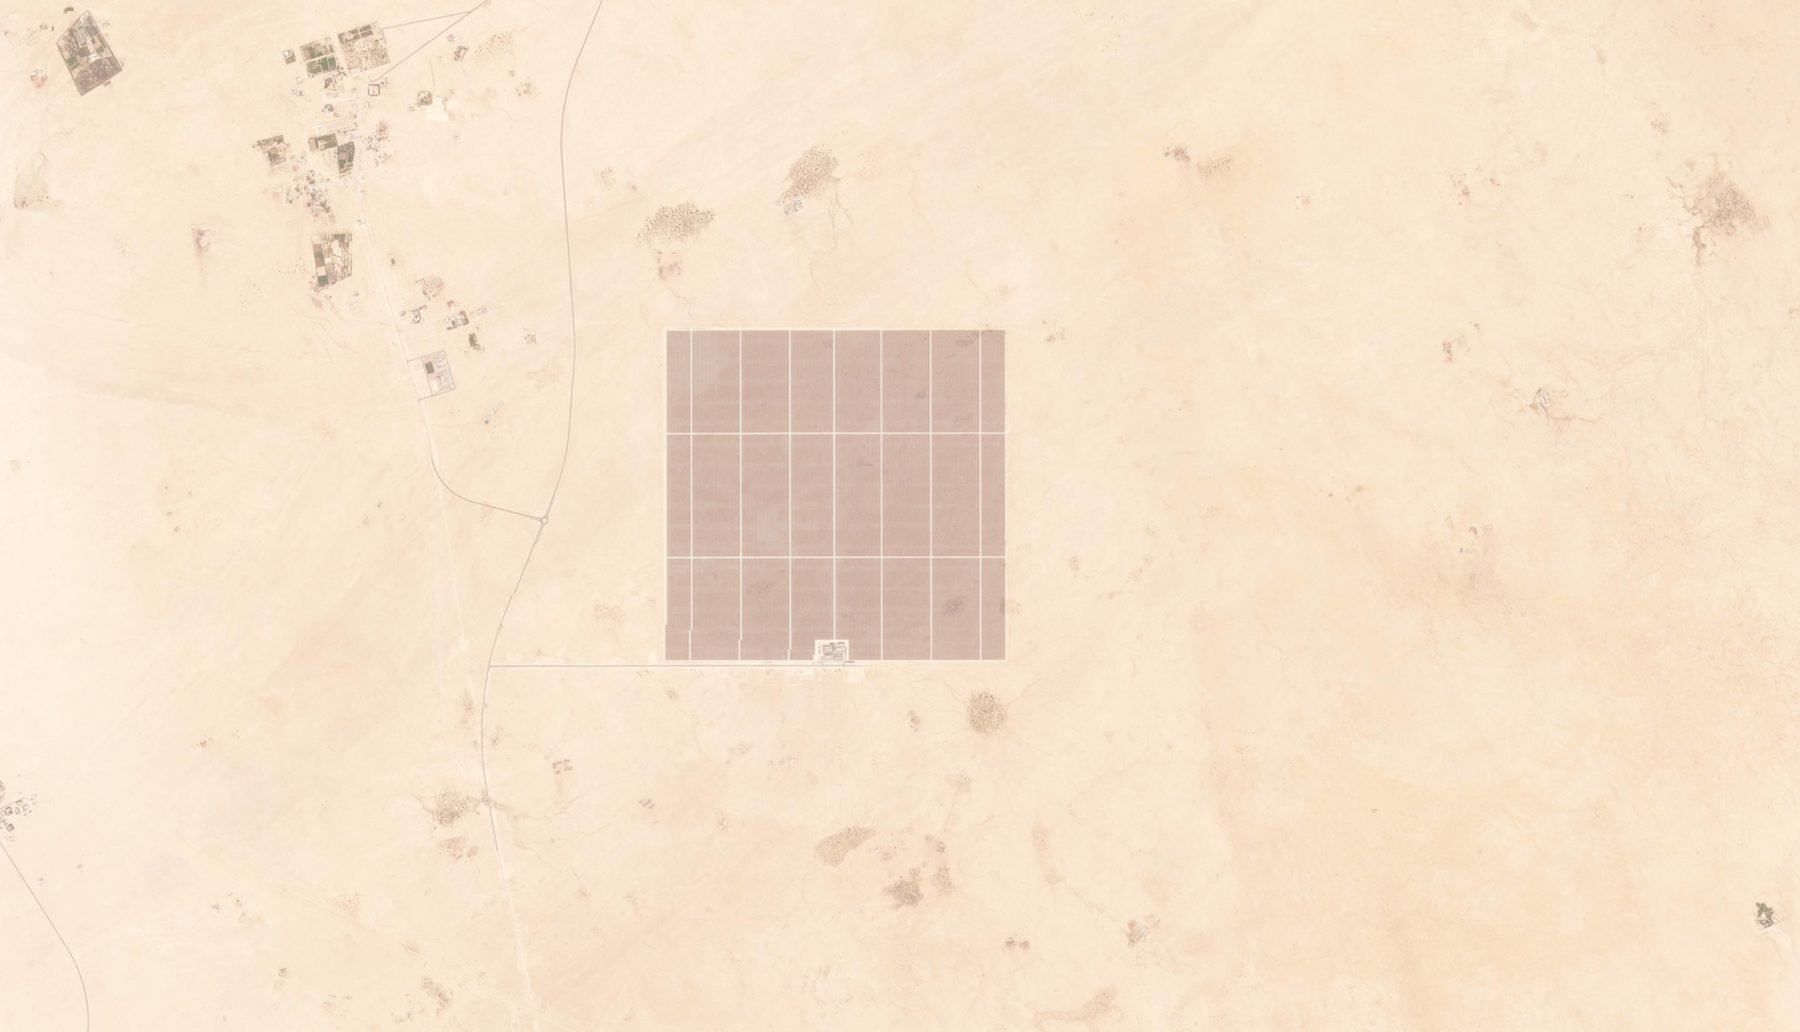
Figure 9 — The Al Kharsaah photovoltaic park, in Qatar, set in flat open desert. The scene covers 41 km²; the park itself occupies a square of about 10 km² at the centre (roughly the historic centre of Milan within the Navigli ring), neatly divided into twelve sub-sectors. Installed capacity is 800 MW, enough to cover about ten per cent of Qatar’s total electricity consumption. The most telling detail is geographic: Al Kharsaah sits about 80 km from Ras Laffan, the LNG complex in Figure 1. The very country that exports twenty per cent of the planet’s liquefied natural gas is building, in its own hinterland, industrial-scale infrastructure to cover its domestic electricity consumption with solar power. The same pattern can be seen in Saudi Arabia (the Sudair park, 1.5 GW, 400 km from Ghawar), in Oman, and in the UAE. It is not a contradiction: the Gulf states would rather export the gas than burn it to produce electricity at home. Source: Planet Labs PBC.
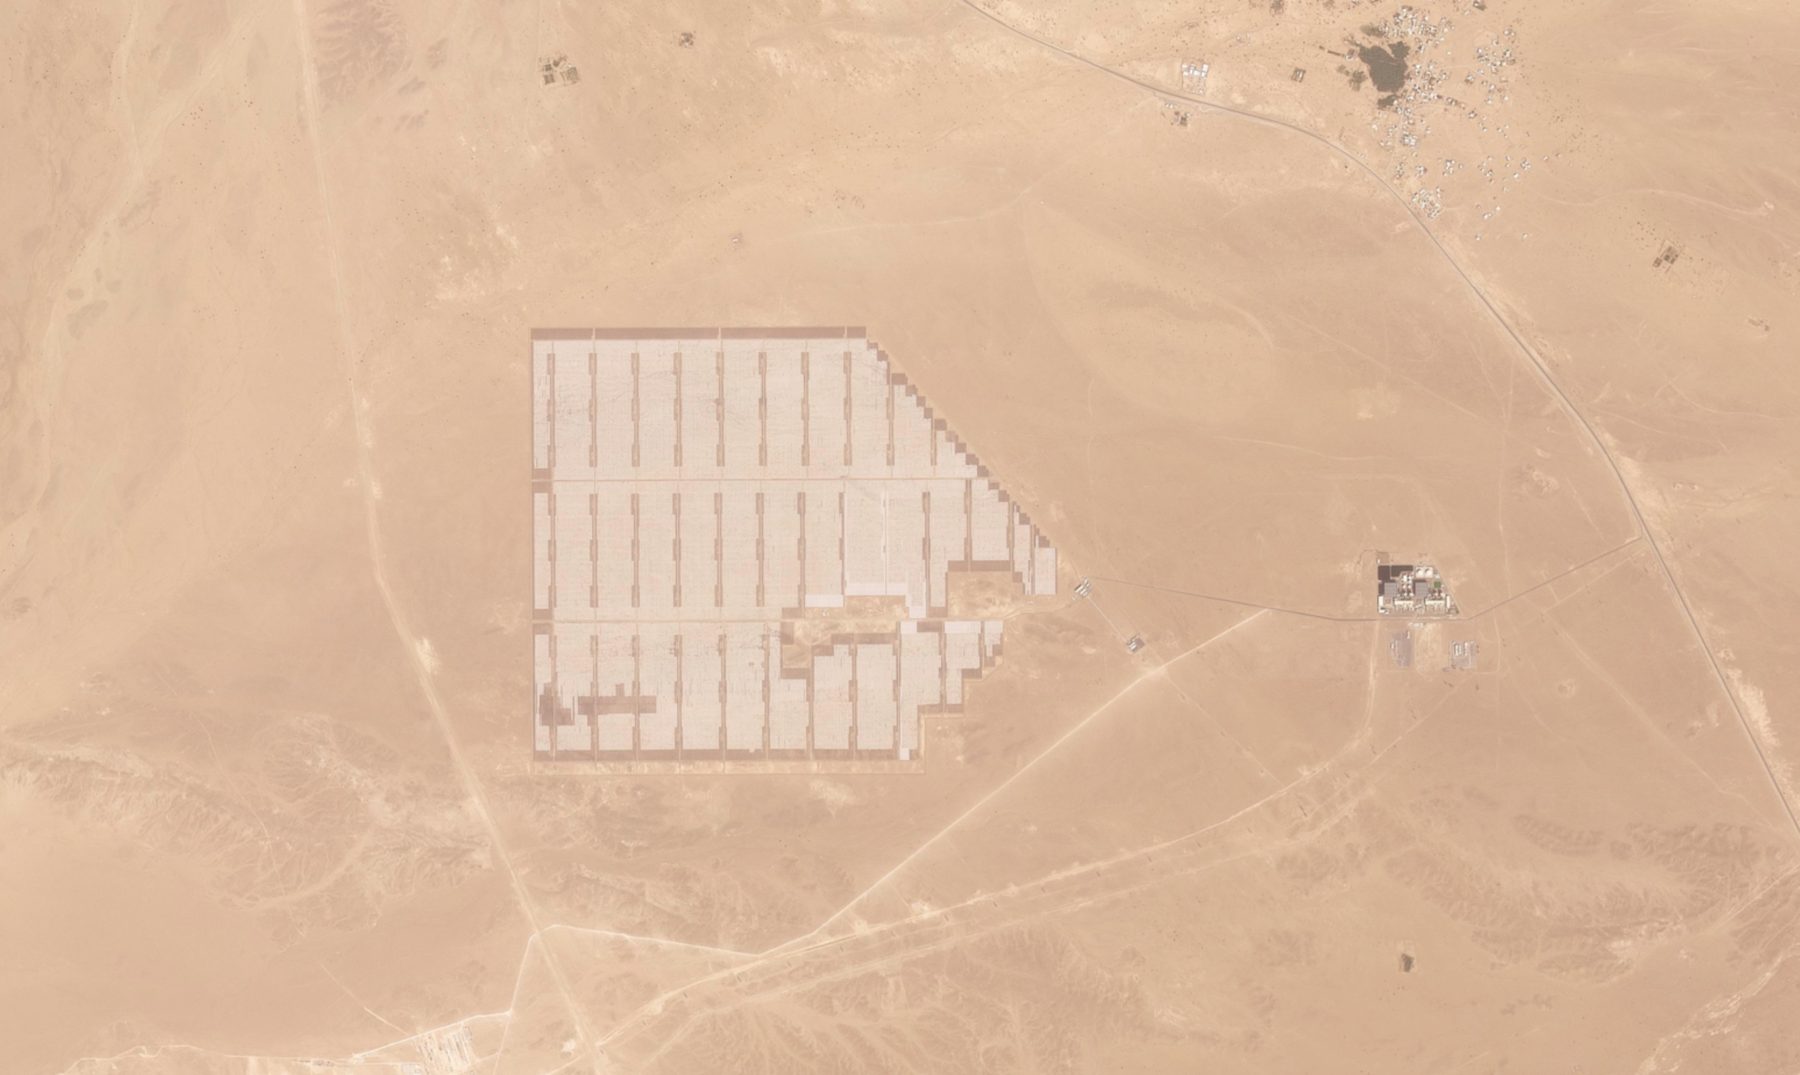
Figure 10 — The Ibri 2 photovoltaic park, in Oman, near the town of Ibri and the route of the domestic pipelines that carry Omani crude toward Sohar and Muscat. The scene covers 38 km²; the park occupies about 13 km² (the equivalent of Rome’s historic centre within the Aurelian Walls). Capacity is 500 MW, and the site was inaugurated in 2022 — the first of the Sultanate’s mega solar projects. Together with Ibri 1 (also 500 MW) and the Manah 1 and 2 projects under construction (1 GW combined), Ibri 2 marks Oman’s official entry into utility-scale solar generation. The surrounding plain has no competing infrastructure: here, the sun occupies the desert simply because it was already empty. Source: Planet Labs PBC.
Two eras, at the same time
Added together, the ten AOIs amount to about 326 km² of imaged territory — roughly the municipality of Rome. The infrastructure visible within these 326 km² alone produces or processes a significant share of the world’s oil and gas, and at the same time hosts some of the largest photovoltaic gigawatt arrays ever installed on the planet. It is a concentration rarely matched elsewhere: to find something comparable, one would probably have to combine the American Gulf Coast with the Houston-Dallas-Tulsa corridor.
There is an interesting temporal fracture here. Ras Laffan opened its first liquefaction train in 1996 and now has fourteen in operation. Abqaiq has existed, in some form, since 1948. Shaybah came into production in 1998. The four artificial islands of Upper Zakum were built between 2010 and 2018. Phase 1 of the Mohammed bin Rashid Solar Park, a mere 13 MW, came online in 2013; today the park is approaching 4 GW. Noor Abu Dhabi dates to 2019. Al Kharsaah to 2022. Ibri 2 to 2022. The two infrastructures, fossil and solar, inhabit the same physical landscape but live on two different timelines: the fossil one is the sediment of seventy years, the solar one the exponential growth of the last ten.
All of this is visible only from orbit. From the ground, in the Najd desert or on the Sweihan plain, most of these structures would simply be invisible, screened by the horizon or by military and private access restrictions. It is PlanetScope, SkySat, Pelican, Maxar, ICEYE, Capella — the generation of commercial low-orbit satellites of the past ten years — that lets a journalist, a researcher, a policymaker see the apparatus. It is a recent achievement. Fifty years ago, a comparable overview would have been a state military secret: today it can be bought for a few hundred euros per square kilometre, or, in the case of Sentinel, for free.
What remains to be seen is what we choose to look at, of this infrastructure, over the next twenty years. If the double acceleration — fossil and solar — continues at its current pace, the Gulf’s next industrial archipelago will be denser still. And seeing it clearly will always, in the end, be a question of scale.